Block 1 · 12:00–12:50 · Field-Ready Implementation
Implementation, Debugging, and
Deployment
- implement project components with explicit error handling, structured logging, configuration validation, and health reporting;
- debug embedded Linux systems systematically across hardware, kernel, process, storage, network, protocol, and application layers;
- collect evidence using Linux inspection, logging, tracing, network-capture, and profiling tools;
- distinguish symptoms, hypotheses, experiments, root causes, contributing factors, and corrective actions;
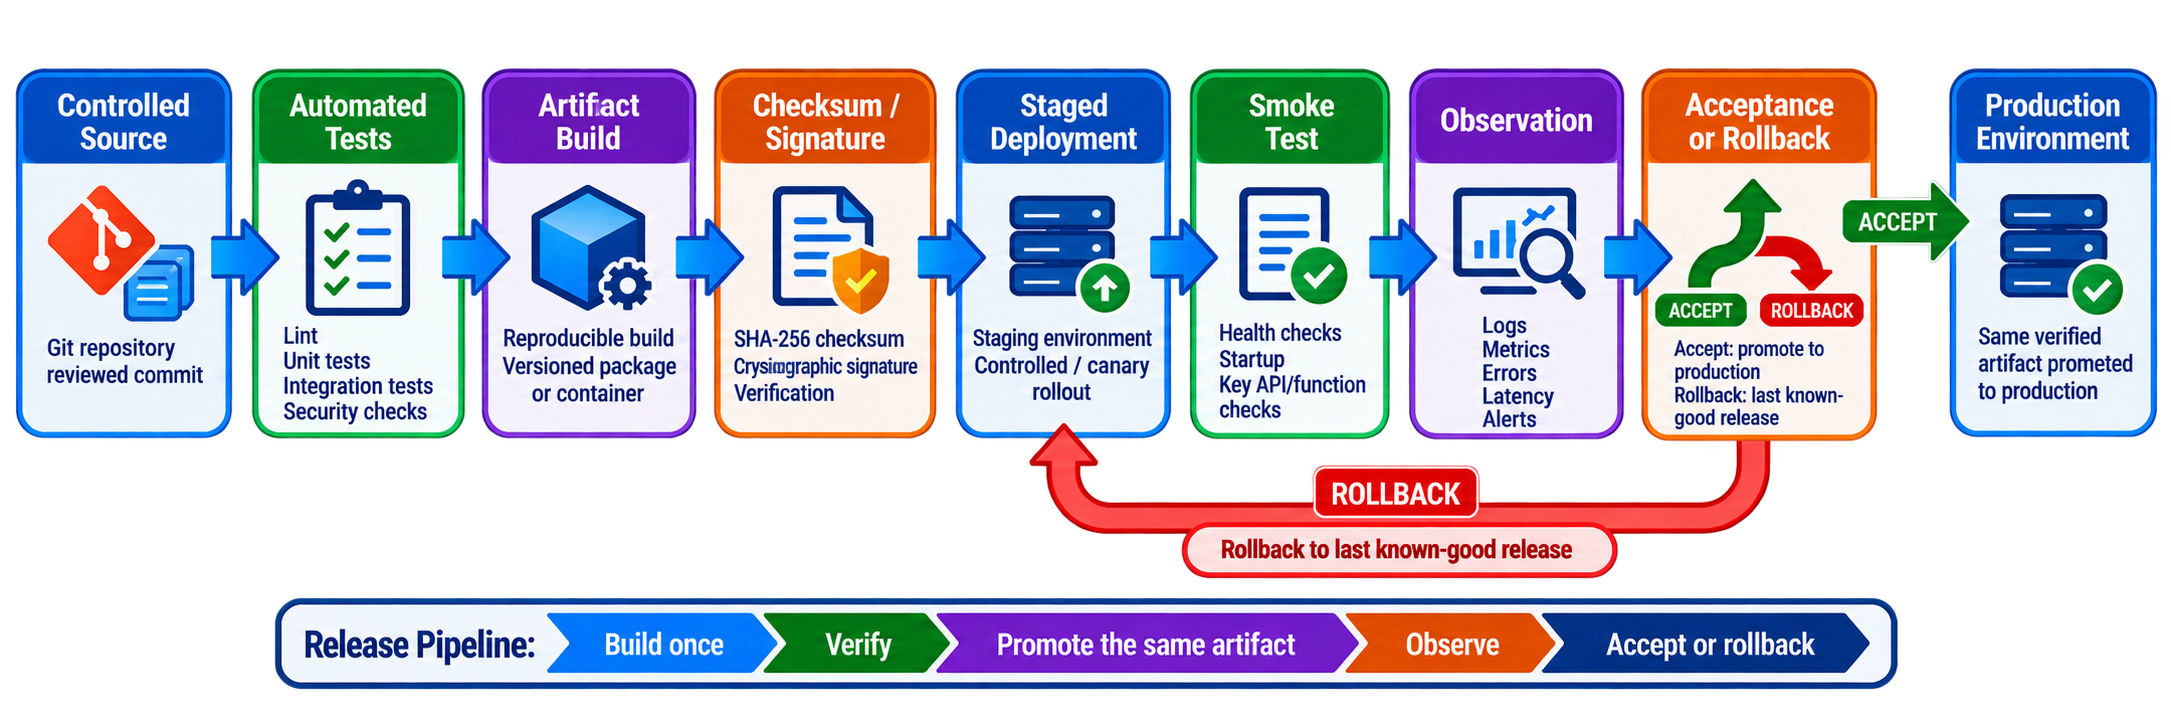
- build identifiable and reproducible release artifacts from controlled inputs;
- deploy through staged procedures with smoke tests, health observation, rollback triggers, and compatible data migration;
- diagnose memory, CPU, storage, I/O, network, energy, and thermal constraints;
- measure latency distributions, throughput, loss, resource use, and long-duration stability;
- verify recovery from process, dependency, network, sensor, storage, configuration, and power failures; and
- present an attributable debugging and release narrative suitable for the final portfolio and a technical interview.
11.1 Implementation Is More Than Writing the Main Algorithm
An application that works once on a developer’s laptop is not yet an embedded service. A field-ready implementation also needs:
- validated configuration and explicit defaults;
- bounded memory, files, queues, retries, and execution time;
- input validation at every interface;
- meaningful exit codes and error categories;
- structured logs, metrics, and health indicators;
- clean startup, shutdown, and restart behavior;
- least-privilege device and network access;
- a defined safe state for physical outputs;
- version and build identification; and
- deployment, update, recovery, and rollback procedures.
The non-functional behavior is often what determines whether a prototype survives outside the laboratory.
11.2 Evidence-Led Debugging
Start by writing the symptom in observable language. “MQTT is broken” is vague. “At 14:03:12 UTC, gateway node 07 completed TCP connection to the broker but received an authorization failure when publishing topic eml/v1/node-07/state” is useful.
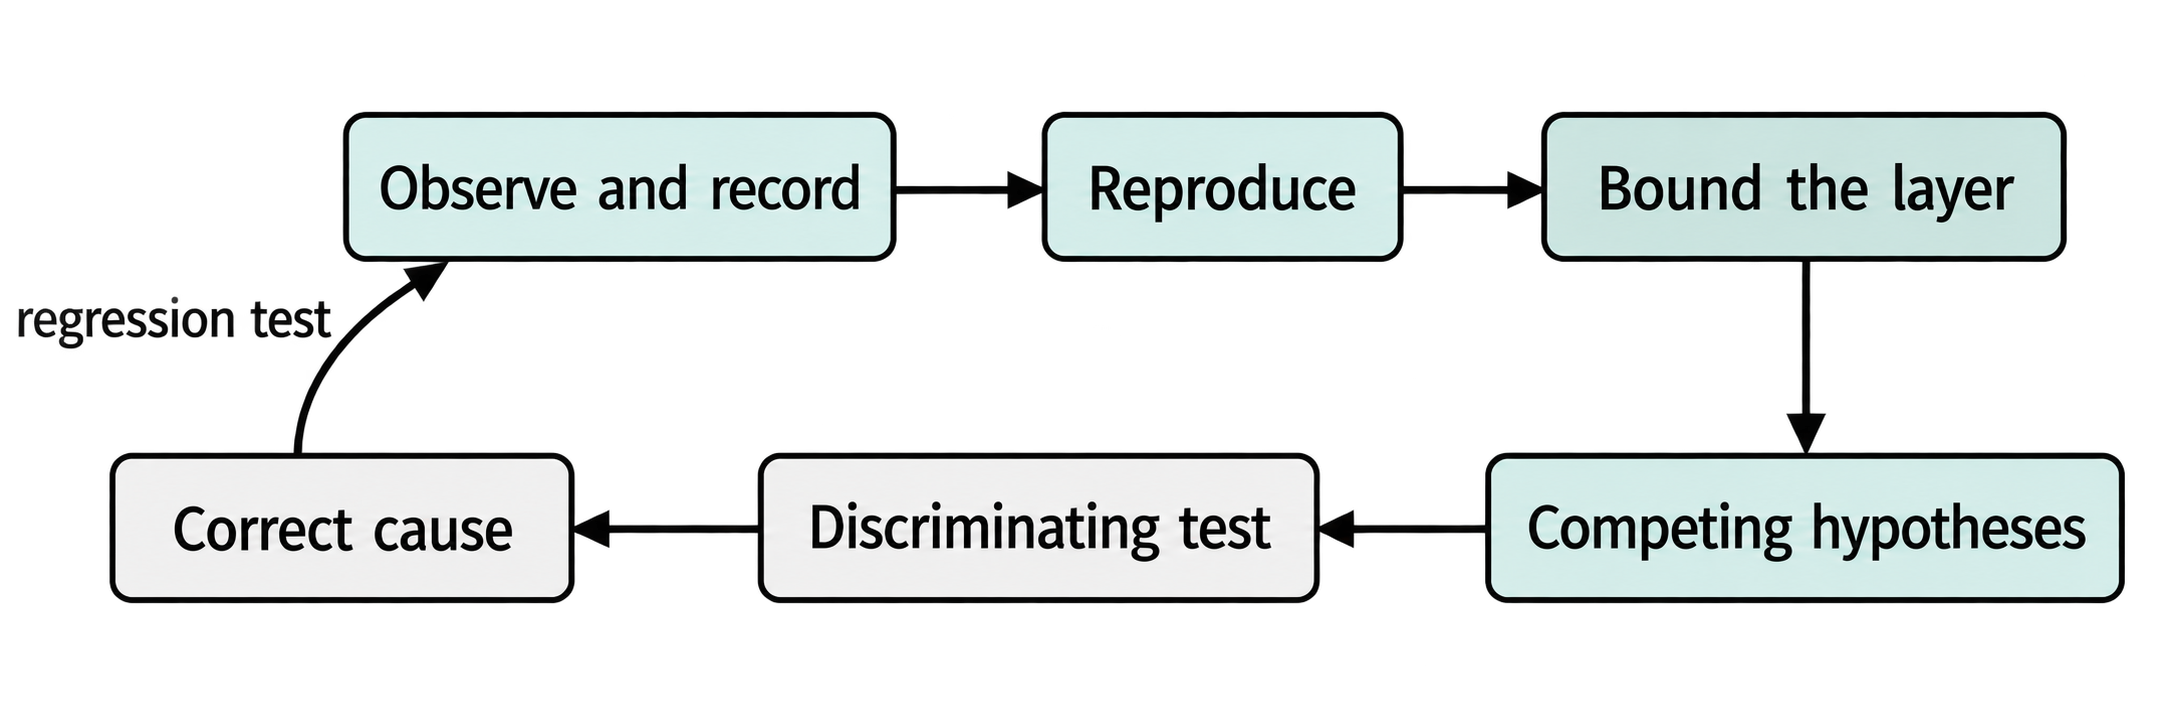
The practical loop is:
- preserve evidence before restarting or changing the system;
- reproduce the fault under controlled conditions;
- identify the earliest layer at which expected behavior diverges;
- list several plausible hypotheses;
- predict what observation each hypothesis implies;
- run the smallest safe experiment that separates them;
- correct the mechanism rather than only the visible symptom;
- add a regression test and monitoring; and
- remove temporary privileges, debug ports, bypasses, and verbose secret-bearing logs.
11.3 Symptom and Root Cause
A symptom is observed abnormal behavior. A proximate cause directly produces it. A root cause is a correctable underlying condition whose removal prevents recurrence in the relevant scope. A contributing factor increases probability or impact without being sufficient alone.
Example:
- Symptom: the sensor service restarts every few minutes.
- Proximate cause: the kernel terminal after memory exhaustion.
- Root cause: an unbounded queue retains measurements during broker outage.
- Contributing factors: no resource limit, no queue metric, and a restart policy without backoff.
- Corrective action: bound the queue, define discard/persistence policy, expose depth, add an outage test, and rate-limit restart.
“Human error” is rarely a sufficient root cause. Ask why the interface, review, test, permission, or procedure allowed one mistake to create the failure.
11.4 Make the Failure Reproducible
Record at least:
- hardware revision, wiring, power source, and connected peripherals;
- operating-system, kernel, firmware, application, and configuration versions;
- exact command, input, workload, and sequence of preceding events;
- time and time-synchronization state;
- network topology, addresses, radio settings, and signal metadata;
- expected and actual behavior;
- occurrence rate and whether restart changes it; and
- logs, metrics, captures, core dumps, or photographs required to preserve the state.
Intermittent faults often correlate with temperature, vibration, load, power, network quality, buffer size, or elapsed time. Maintain a table of occurrences rather than relying on memory.
11.5 Debug from the Physical Layer Upward
For embedded systems, begin with the lowest credible layer:
| Layer | Questions | Evidence and tools |
|---|---|---|
| Physical/power | Correct voltage, polarity, ground, current, connectors, antenna, thermal state? | Multimeter, oscilloscope, supply log, visual inspection, thermal measurement |
| Kernel/device | Was hardware enumerated and bound to the expected driver? | dmesg, lsusb, lspci, lsblk, /sys, /dev |
| Permission | Which identity owns the process and device? | id, ls -l, groups, udev rules, service sandbox settings |
| Process/service | Did it start, exit, hang, or restart? | systemctl, journalctl, ps, exit status, coredump |
| Resource | CPU, memory, disk, I/O, temperature, file descriptors? | top, free, df, du, vmstat, iostat, lsof |
| Network | Link, address, route, DNS, listener, firewall? | ip, ping, dig, ss, tcpdump, curl |
| Protocol | Correct framing, topic, schema, QoS, timing, authentication? | Protocol logs, capture, broker log, known-good client, recorded frames |
| Application | Correct state, algorithm, units, calibration, and policy? | Structured logs, metrics, debugger, tests, profiler, domain reference |
Do not begin by rewriting application code if the input voltage collapses when a motor starts.
11.6 Linux Inspection Commands
Run commands with the least privilege necessary. Capture relevant output with timestamps and explain what each command proves and does not prove.
| 1 2 3 4 5 6 7 8 |
date --iso-8601=seconds uname -a cat /etc/os-release uptime systemd-analyze systemd-analyze blame | head -20 journalctl --list-boots journalctl -b -p warning dmesg --level=err,warn |
dmesg reports kernel messages but may require elevated permission. A driver message proves that the kernel observed an event; it does not prove that the application received valid data.
| 1 2 3 4 5 6 7 |
systemctl status eml-acquire.service --no-pager systemctl show eml-acquire.service \ -p ActiveState -p SubState -p Result -p NRestarts journalctl -u eml-acquire.service -b --since "10 minutes ago" ps -eo pid,ppid,user,state,etimes,%cpu,%mem,cmd --sort=-%cpu | head pgrep -a acquire cat /proc/PID/status ls -l /proc/PID/fd | head |
A process in active (running) state may be deadlocked or producing stale data. Health must include useful progress.